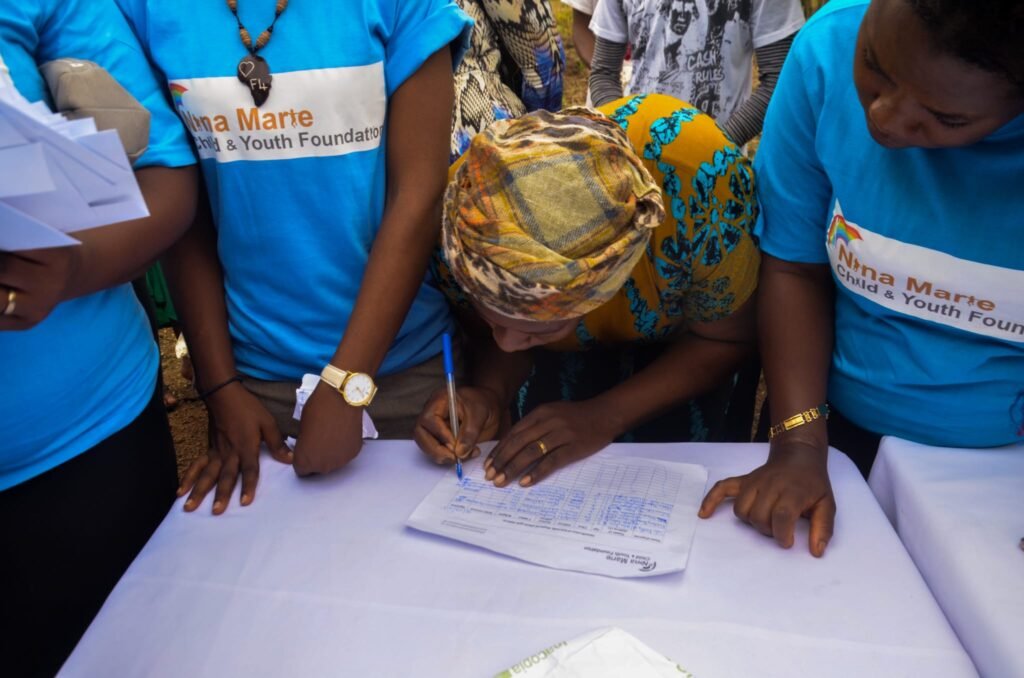
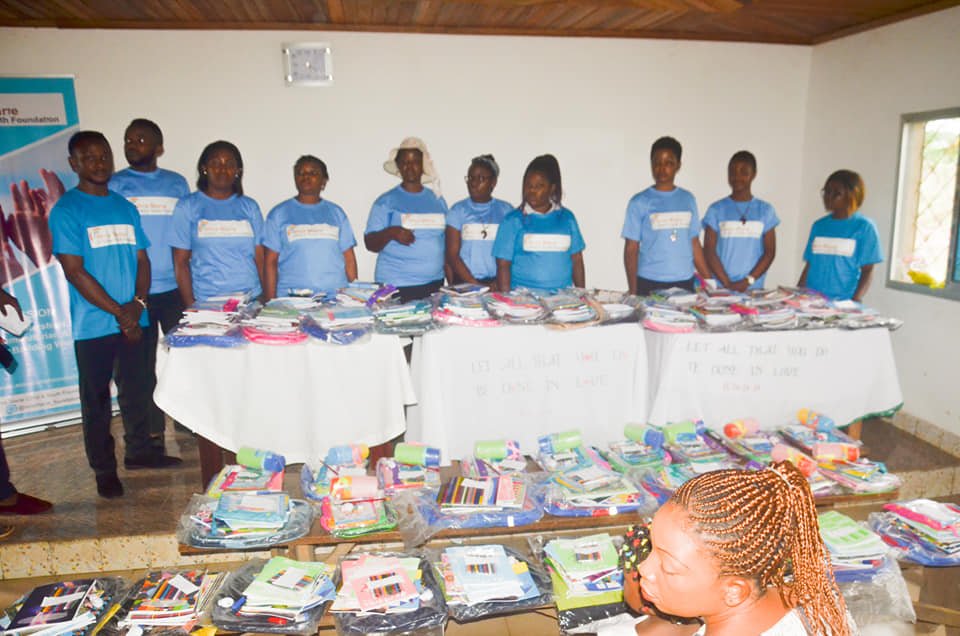
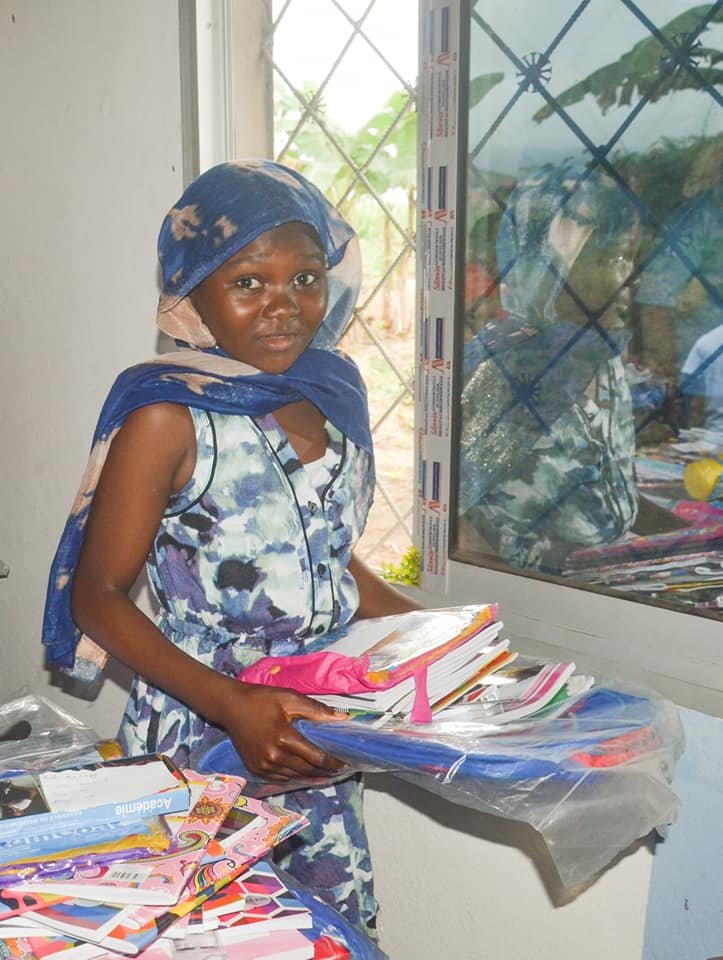
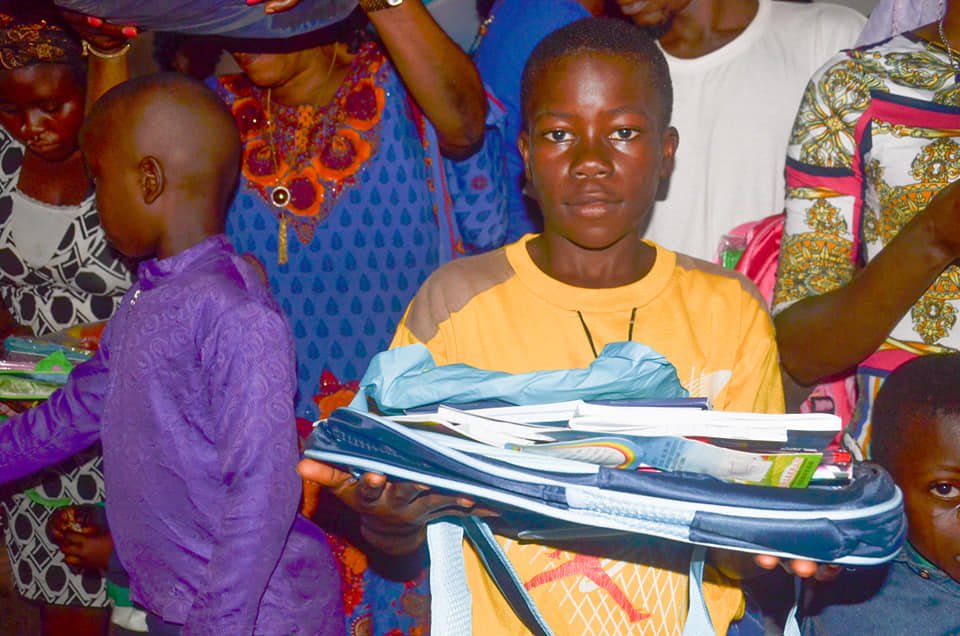
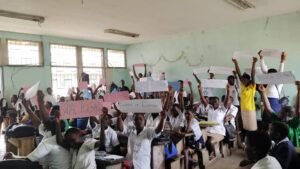
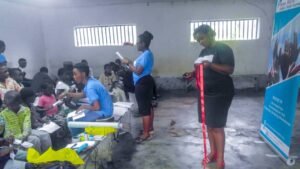
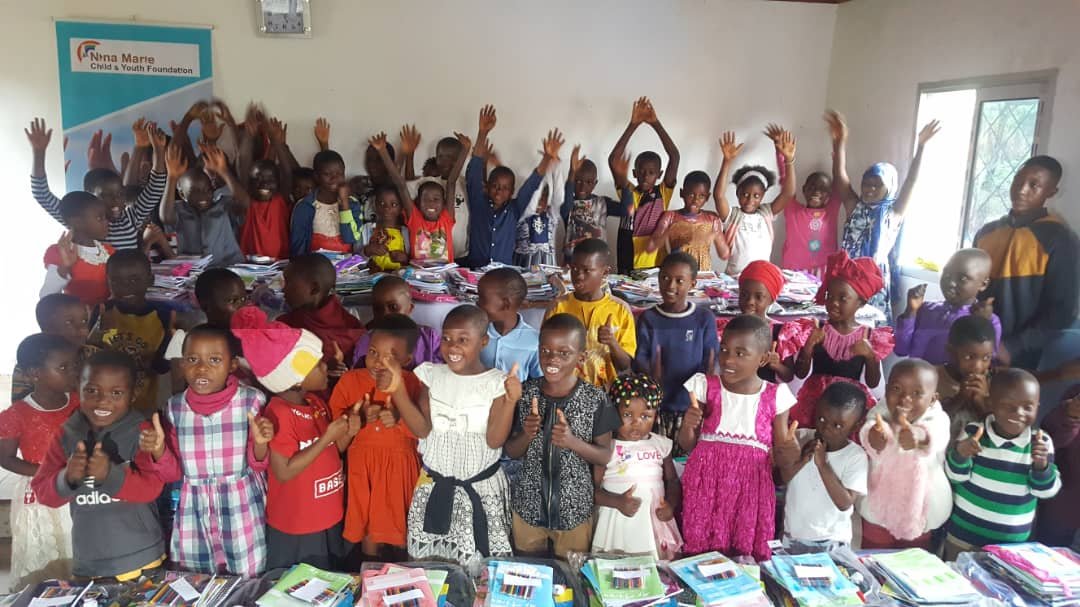
Dot Density Map: A thematic map that places dots within an enumeration unit in
proportion to the represented value to maintain the distribution and variation of
density of a phenomenon of interest (Dent et al. 2018; MacEachren and DiBiase
1991).
Flow Map: A thematic map that represents the route and/or magnitude of a
phenomenon alongside linear objects or between locations (Lechner et al. 2009).
Graduated Symbol Map: A classified proportional symbol map of interest (Gao et
al. 2019).
Isoline/Isarithm: A line derived via interpolation that connects points of equal
attribute value on a map of interest (Childs 2004).
Isoline Interval: The numerical distance between successive isolines/isarithms of
interest (Chibryakov 2021).
Isometric Map: A thematic map that makes use of isolines as a result of
interpolating values collected at sample points of interest (Steele et al. 1998).
Isoplethic Map: A thematic map that makes use of isolines on account of
interpolating values enumerated across areas of interest (Yang and Shang 2013).
Proportional Symbol Map: A thematic map that scales the size of a point symbol
proportional to the represented value of interest (Dent et al. 2018).

Lorem Ipsum
Lorem Ipsum is simply dummy text of the printing and typesetting industry. Lorem Ipsum has been the industry’s standard dummy text ever since the 1500s..